The Census Added the Word "Norwegian" to the Form in 2000. Norwegian Ancestry Rose by 608,330.
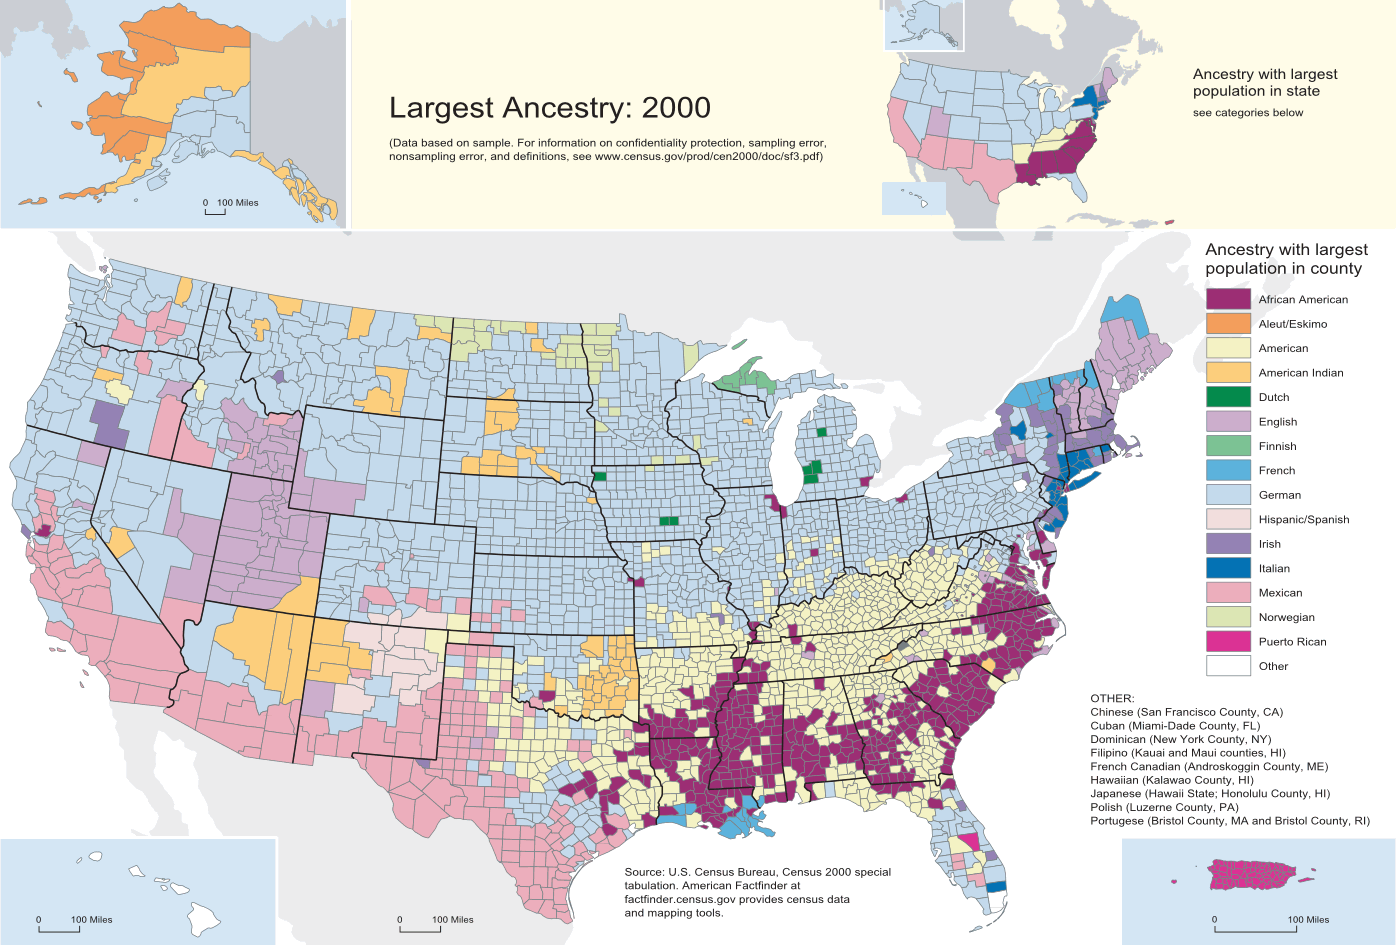
In 2000 the United States Census Bureau printed a new word on the ancestry question.
The question itself was unchanged — What is this person’s ancestry or ethnic origin? — and it had been asked since 1980. What changed was the list of examples printed beside it to show respondents the kind of answer wanted. In 1980 that list ran: African American, English, French, German, Honduran, Hungarian, Irish, Jamaican, Korean, Lebanese, Mexican, Nigerian, Polish, Ukrainian, Venezuelan. In 1990 it was revised: German, Italian, Afro-Amer., Croatian, Cape Verdean, Dominican, Ecuadorean, Haitian, Cajun, French Canadian, Jamaican, Korean, Lebanese, Mexican, Nigerian, Irish, Polish, Slovak, Taiwanese, Thai, Ukrainian.
Neither list contained a single Nordic or Baltic nationality.
The 2000 list did. It read: Italian, Jamaican, African Am., Cambodian, Cape Verdean, Norwegian, Dominican, French Canadian, Haitian, Korean, Lebanese, Polish, Nigerian, Mexican, Taiwanese, Ukrainian.
Between 1990 and 2000, the number of Americans reporting Norwegian ancestry rose by 608,330, or 15.7 percent, from 3,869,395 to 4,477,725.
Over the same decade Swedish ancestry fell 14.6 percent. Danish fell 12.5 percent. Lithuanian fell 18.7 percent. Finnish fell 5.4 percent.
Norwegian was the only one of the eight Nordic and Baltic ancestries to rise. It was also the only one added to the examples.
What the Bureau will and will not say
The Census Bureau does not claim that the example list drives responses. Nothing in its published methodology says so, and the inference here is this publication’s, not the Bureau’s. There is a competing explanation for at least part of the pattern: the parallel case of English ancestry, which was in the 1980 examples, was dropped for 1990, and fell from roughly 49.6 million to 32.7 million to 24.5 million across those two decades — a collapse usually attributed to the rise of “American” as a write-in answer rather than to the wording of the prompt. Both mechanisms are probably running at once.
But whichever one you prefer, the implication is the same, and it is not comfortable: a number that moves by six hundred thousand people in response to the design of a form is not a measurement of who Americans are. It is a measurement of what they were asked.
The denominator moved further than any of the groups
Here is the figure that should be quoted before any of the others, and almost never is.
In 1990, 89.5 percent of the United States population gave an ancestry that could be coded — 222,608,257 people out of 248,709,873. By 2000 that had fallen to 80.1 percent. In the 2024 American Community Survey it was 75.3 percent: 256,267,060 specified out of a population of 340,110,990. Almost 73 million people did not answer the question at all, and a further 10.8 million gave something that could not be classified.
Roughly one American in four now declines to give a codeable ancestry, against roughly one in ten in 1990.
Against that backdrop, look at what the ACS recorded in 2024: Norwegian 3,864,701. Swedish 3,251,869. Danish 1,110,484. Finnish 612,181. Lithuanian 593,350.
Norwegian is down 13.7 percent on 2000, Swedish 18.7 percent, Danish 22.4 percent, Lithuanian 10.1 percent. Finnish is essentially flat.
Now notice that the response rate to the question itself fell by about six percentage points over the same period, on a rising population. A group can shed a fifth of its recorded count without one living person changing their mind about their grandmother.
There are now two numbers for “Norwegian”, and they disagree
The confusion that has entered diaspora reporting over the last three years comes from treating two different instruments as one series.
The ancestry question lives on the American Community Survey. It was not on the 2010 census and it was not on the 2020 census. The Bureau’s own comparability guidance for the 2024 ACS says so in four words: “The question was not asked in the 2020 Census.” For 2023 against 2024, by contrast, its instruction is simply: “Compare.”
What the 2020 census did have, for the first time, was dedicated write-in boxes beneath the White and the Black or African American race categories, and a rebuilt coding system behind them. The results were published on 21 September 2023 as the Detailed Demographic and Housing Characteristics File A, counting 104 detailed White groups. English came out at 46.6 million, German at 45 million, Irish at 38.6 million.
That is a race question. The ancestry question is a different question, with a different universe and different coding rules, and the Bureau warns that even the race results should not be set against 2010 without caution: “Comparisons between the 2020 Census and 2010 Census detailed race data should be made with caution and take into account improvements made to the race question and to the way the Census Bureau codes responses.”
Set the two side by side for the same eight groups and the gap is plain. The 2020 census detailed race counts: Norwegian 3,836,884, Swedish 3,839,796, Danish 1,314,209, Finnish 684,373, Icelandic 55,602, Estonian 30,054, Latvian 92,944, Lithuanian 711,089. Against the 2024 ACS ancestry counts above, the census figure is about 18 percent higher for Swedish and Danish and 20 percent higher for Lithuanian, while Norwegian, Icelandic, Estonian and Latvian come out roughly level.
Four years separate the two datasets, so some of that gap is simply the denominator effect again. The rest is that they are not the same question.
And from the 2024 data products onward, both exist simultaneously. In a user note published in September 2025, the Bureau set out what that means: detailed White and Black groups were added to the ACS race tables in 2024, so that groups “will be available in race and ancestry tabulations, leading to instances of ‘overlapping’ groups or estimates. The overlapping group estimates may differ due to differences in the way race and ancestry data are defined, collected, processed, and reported.”
There are now two official federal numbers for how many Norwegian-Americans there are. Anyone quoting one of them in an argument about decline should say which.
Where the decline story breaks
If the Nordic numbers were simply measuring assimilation, every group in the region would move together. They do not.
On the same ACS instrument, over the same twenty-four years, Icelandic ancestry is up 27.5 percent and Estonian up 21.2 percent. Latvian is up 5.1 percent, though that rise sits inside its margin of error and should not be leaned on. These are the three smallest groups on the list. They are also the three with the most recent migration histories and the most active homeland-state engagement.
The pattern holds outside the census too. Lithuania’s Migration Department reported that 3,571 people regained Lithuanian citizenship in 2024, against 2,402 in 2023 — a rise of 48.7 percent in a single year. The number of people holding Lithuanian citizenship alongside another passed 79,000 by January 2025, up from about 69,000 twelve months earlier. Those are all-country totals rather than North American ones, but the direction is unambiguous, and it runs precisely opposite to the ancestry line.
Something is going up. It is not the thing the census measures.
What is going down is membership
The one series that has fallen without any methodological asterisk is participation.
Sons of Norway had about 90,000 members in 1995. By 2010 it had 64,186. At the end of 2013 it reported 58,178 members across 380 lodges — 54,435 in the United States, 2,499 in Canada, 1,244 in Norway. That 2013 figure is the most recent this publication could verify from a published source, which is itself a finding.
The Vasa Order of America peaked at 72,261 members in 1929 and reported about 35,000 in 1979 and again in 1994. It publishes no current membership figure.
Set the older organisational number against the newer ancestry number — an imperfect comparison across an eleven-year gap, and offered as an order of magnitude rather than a statistic — and roughly one American in sixty-six who tells the government they are Norwegian belongs to the largest Norwegian-American organisation in the country.
Herbert Gans gave this shape a name in 1979: symbolic ethnicity, an attachment that can be felt without being incorporated into daily life. Mary Waters and Richard Alba spent the following decade demonstrating it empirically in white America. The finding has held for forty-five years, and consumer genomics has made it cheaper to hold than ever — more than 30 million people are now in Ancestry’s DNA network, and roughly 14 million in 23andMe’s, a database that in 2025 passed through Chapter 11 and was sold for $305 million to a non-profit founded by the company’s own former chief executive.
A DNA result is an inference from a genome. A census answer is a claim about oneself. A lodge membership is a Tuesday evening.
The three numbers have never described the same thing, and the gap between them is not new. What is new is that the middle one — the self-report, the one every diaspora organisation quotes in its grant applications — has been quietly rebuilt underneath everyone, twice, and the Bureau is openly considering removing it altogether. Research tables released on 26 September 2024 comparing race and ancestry responses across more than a hundred groups were published, in the Bureau’s words, to “inform future recommendations about the possible removal of the ancestry question.”
It is still being asked. It was collected in 2024. But the sector that depends on it should probably know that it is on the table.
Ancestry counts for 1990 and 2000 are from the Census 2000 brief Ancestry: 2000 (C2KBR-35) and Census 2000 Summary File 3 table QT-P13. The 2024 figures are from American Community Survey 1-year table B04006; response-rate figures from table B04007. The 2020 census detailed race counts are from the Detailed DHC-A, table T01001, “alone or in any combination”. Figures for 1980, the first year the ancestry question was asked, are held in a scanned report without a machine-readable text layer and are not quoted here. Map: United States Census Bureau, Census 2000 data on the most commonly reported ancestry by county; public domain, via Wikimedia Commons.

)%20(1).avif)